Data Dashboard
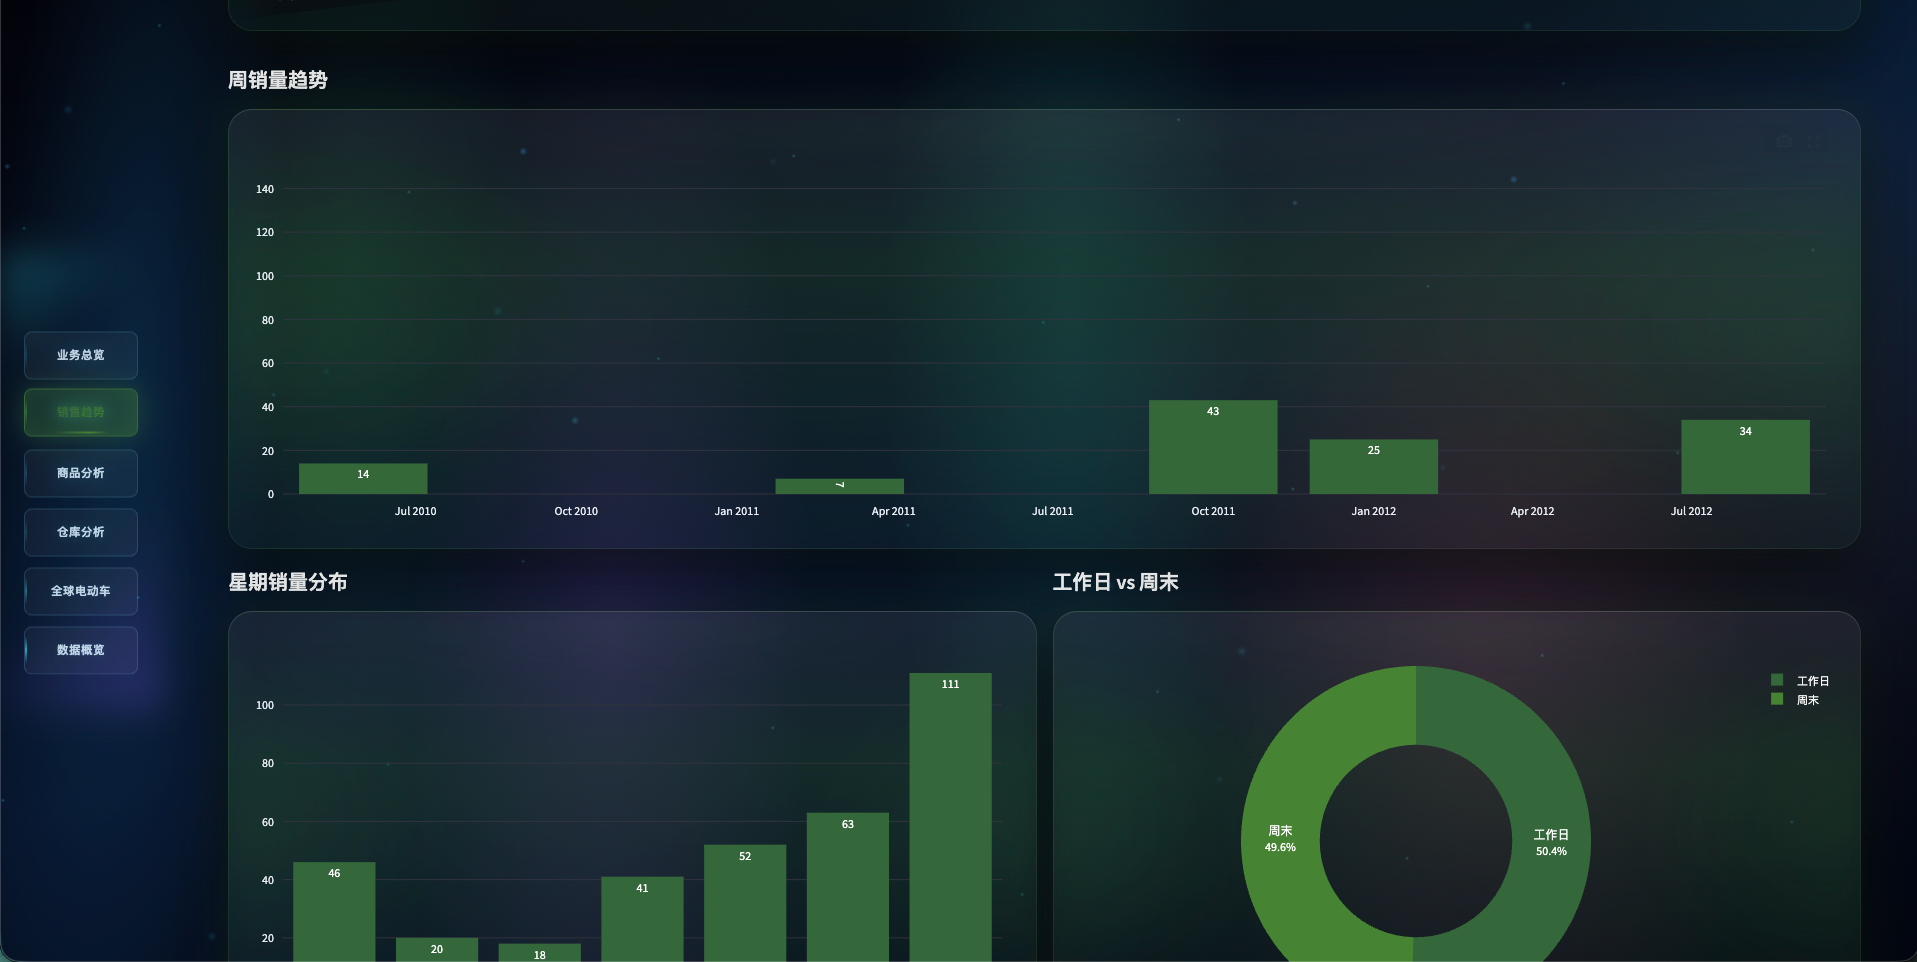
Data Dashboard is LakeInsight's self-service BI visualization dashboard service. Users write Python code and deploy it as interactive dashboards with charts, data analysis, and visualization capabilities. Once running, each dashboard generates a unique link that can be shared with team members.
Navigate via Data Services → Data Dashboard:
Feature Overview
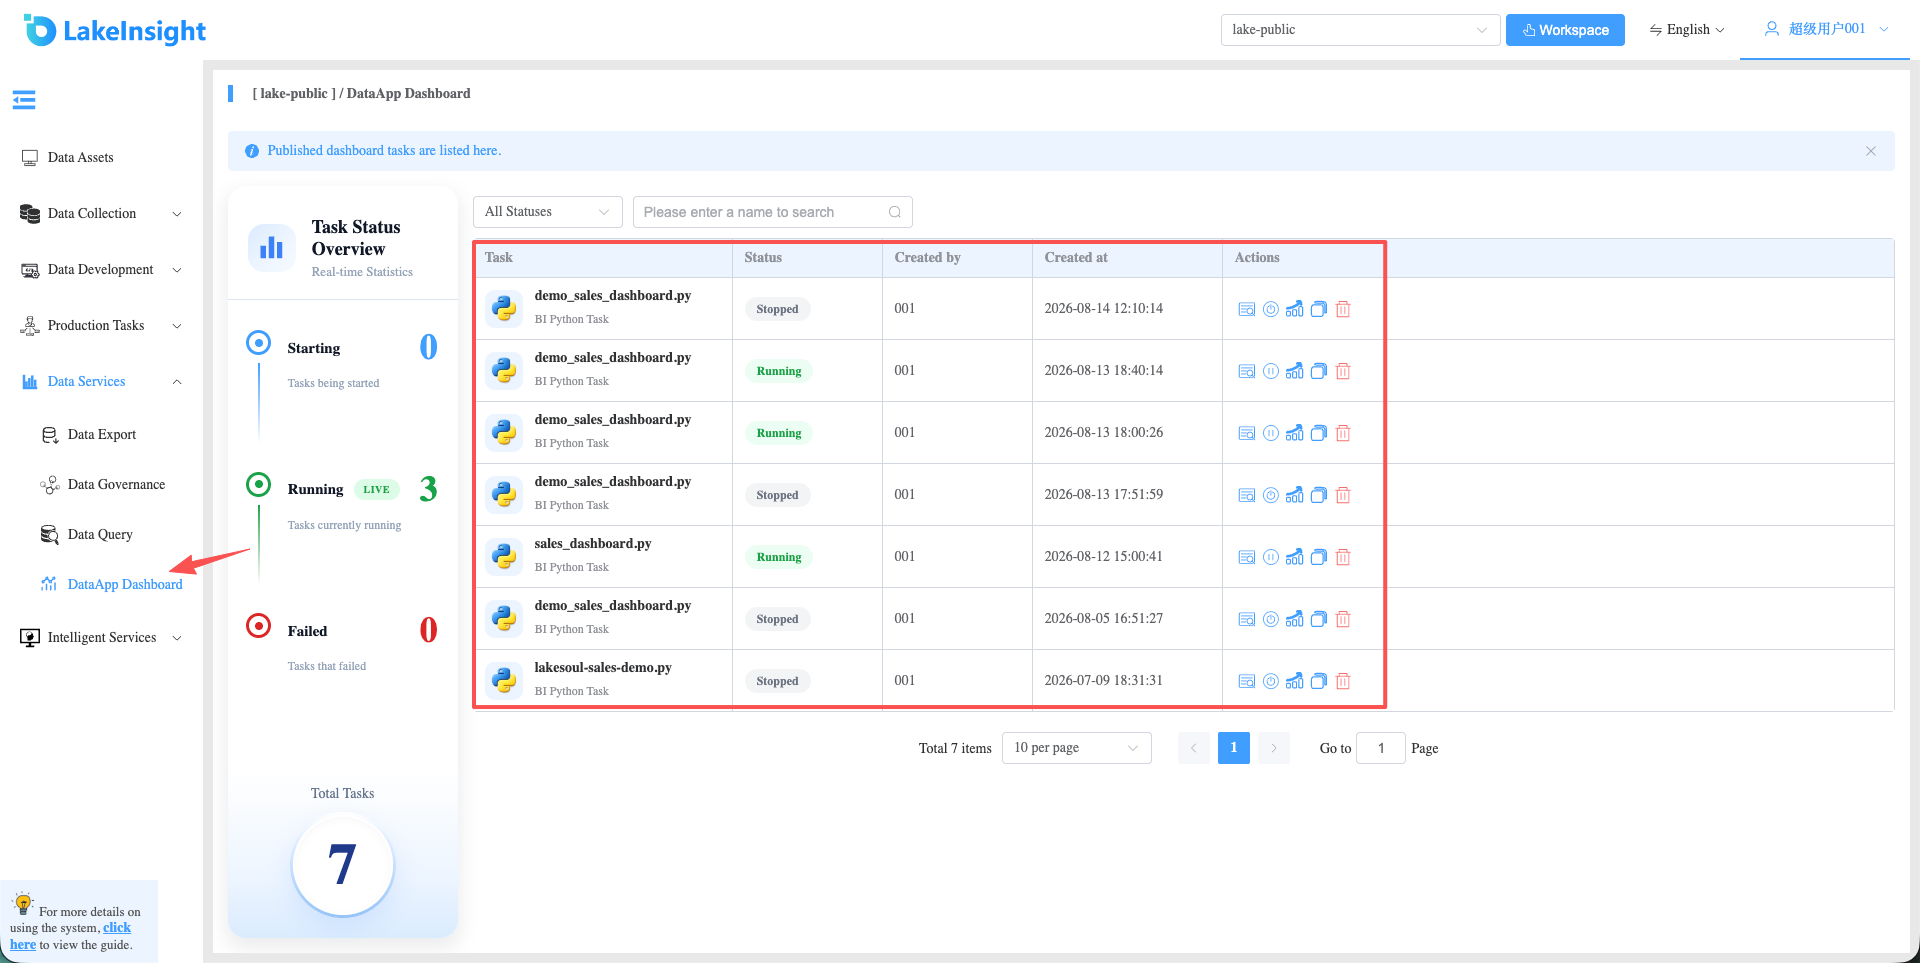
The Data Dashboard interface consists of three main areas:
- Left Status Overview: Real-time task status distribution statistics, including counts of starting, running, and failed tasks, plus the total number of tasks.
- Right Task List: Paginated list of all dashboard tasks in the current workspace, with support for status filtering and keyword search.
- Action Buttons: Each task row provides View Details, Start/Stop, View Dashboard, Copy Link, and Delete actions.
Create a Dashboard Task
Dashboard tasks are created in the development environment. Navigate via Data Intelligence Dev → Dev Environment, create or start a development task, then click Go to IDE to enter the IDE editor.
There are two ways to create a dashboard task:
Method 1: AI Assistant
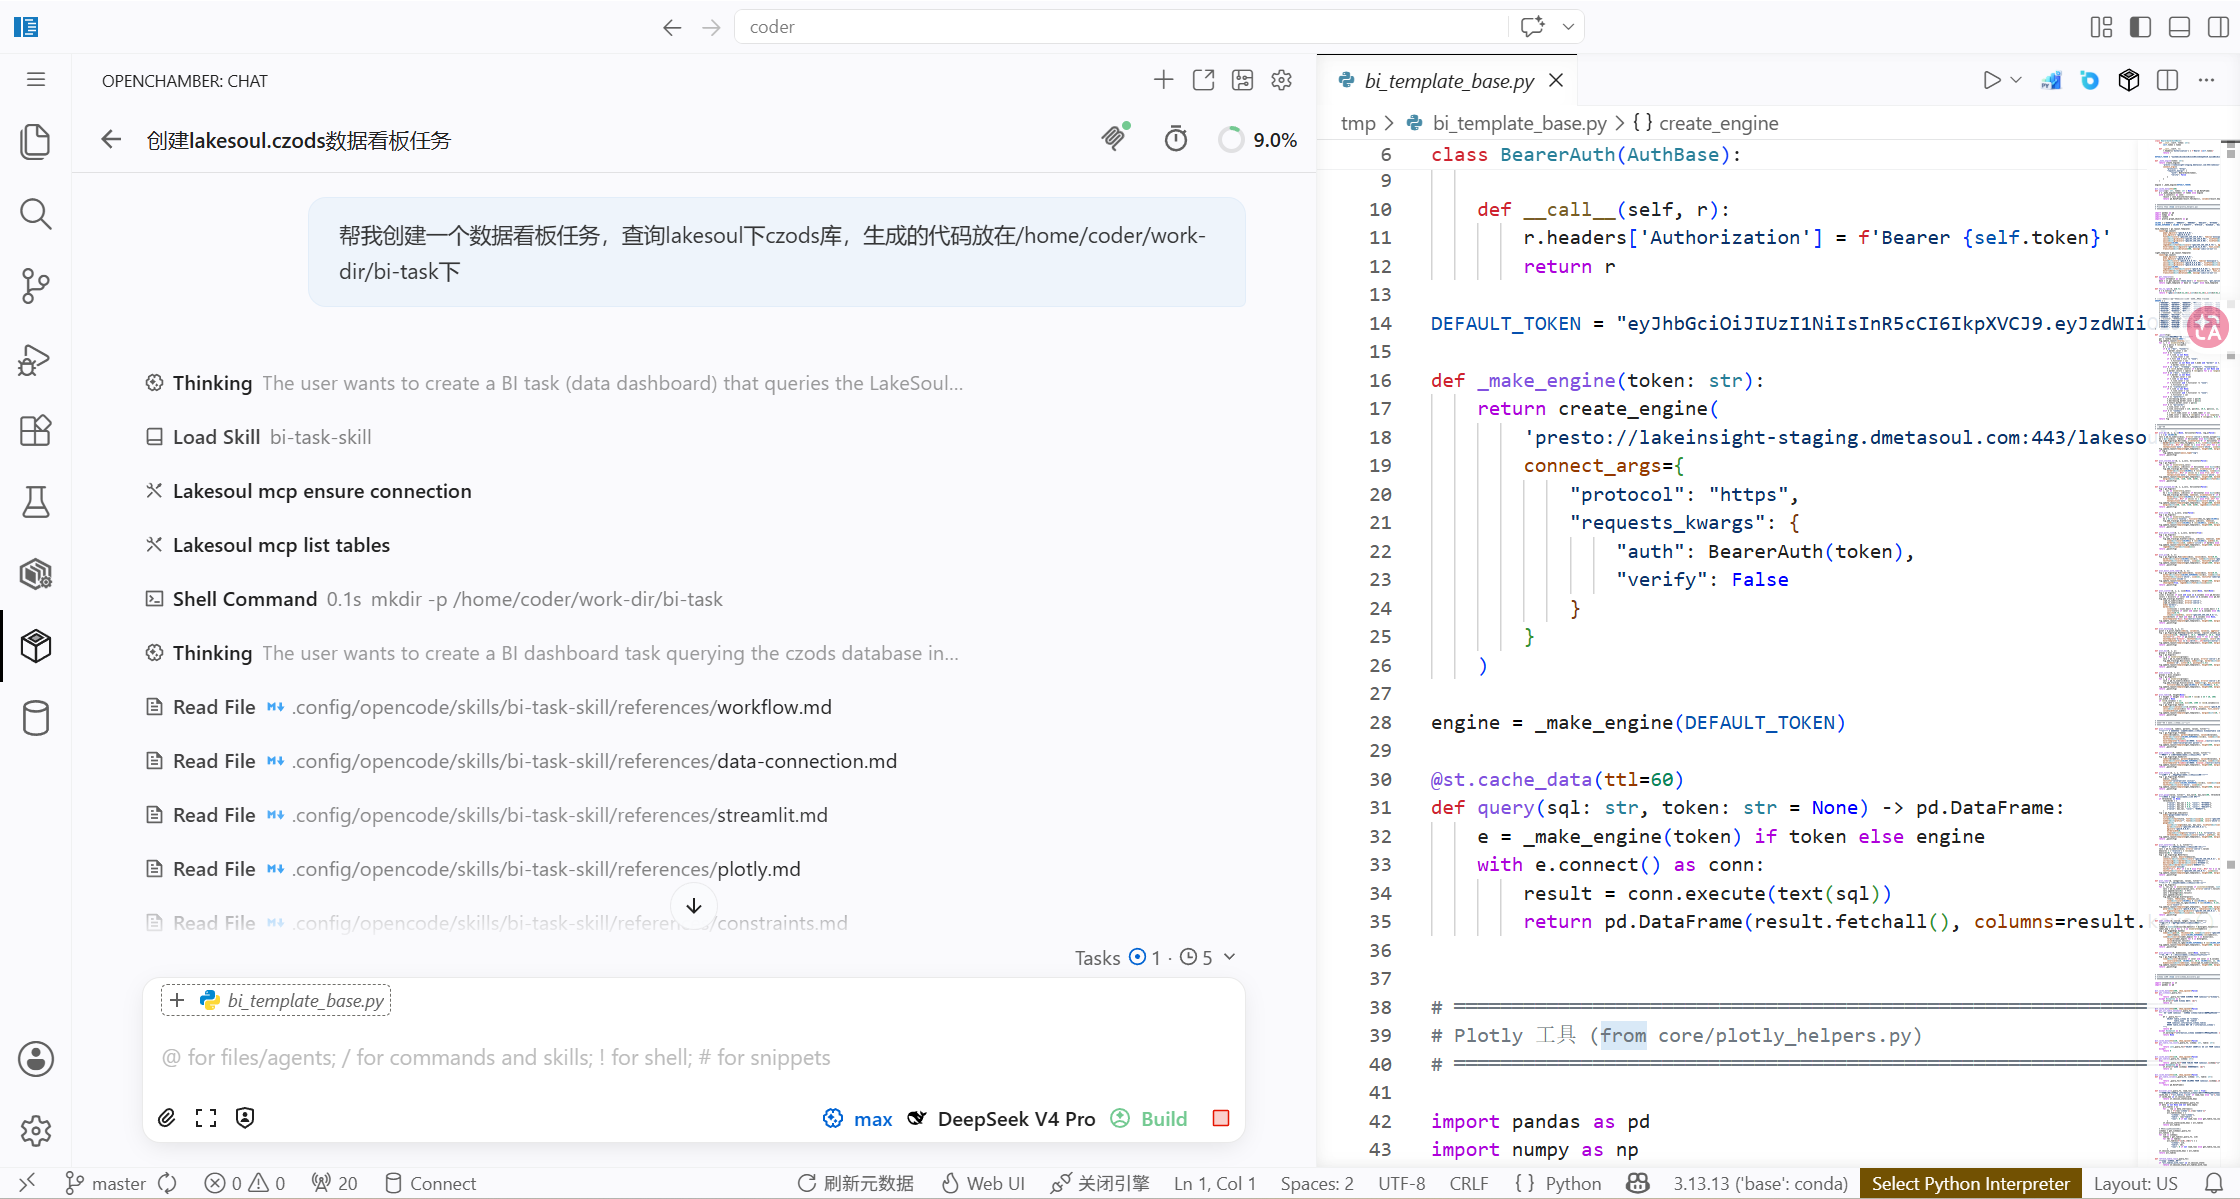
The IDE includes the OpenChamber AI chat assistant with built-in MCP integration, allowing you to quickly generate dashboards using natural language.
In the IDE, click the OpenChamber button in the left sidebar to open the AI chat assistant.
Describe your requirements in natural language, for example:
Create a dashboard task for me, query the tables in the czods database under lakesoul, and save the generated code under work-dir/bi-task
The assistant will automatically read table schemas and data from the corresponding LakeSoul database, intelligently generate a Python dashboard script, and auto-publish it as a dashboard task.
Method 2: Manual Creation
Write code manually in the IDE and publish it as a dashboard task.
In the IDE file tree, right-click to create a
.pyfile and write your dashboard code.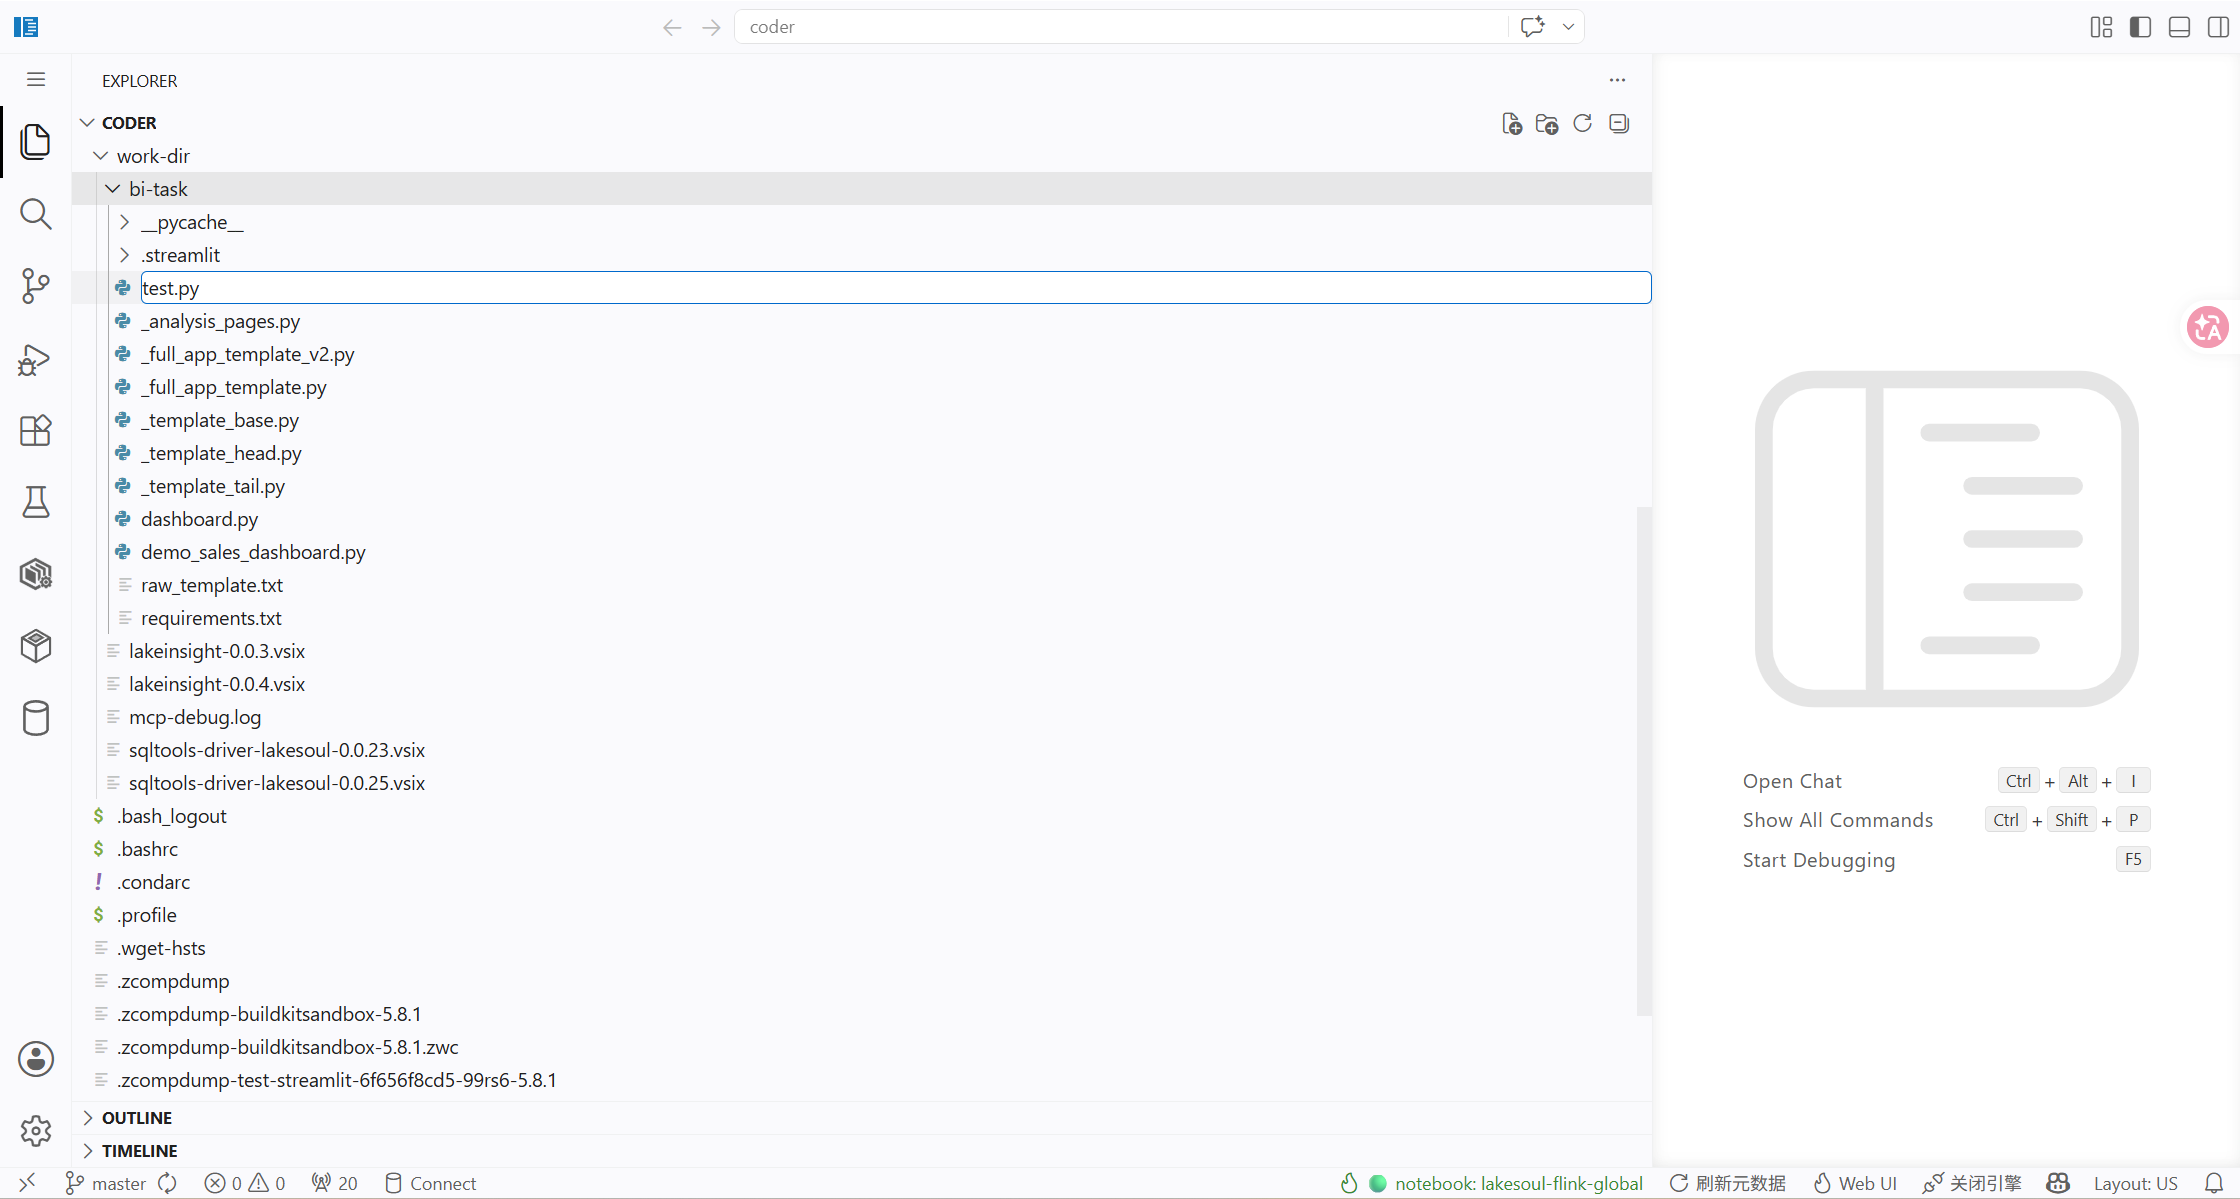
Once the code is ready, open the Python file and click the Publish Data Dashboard Task button in the upper right to publish it.
After publishing, you can view and manage the task in Data Services → Data Dashboard.
Starting and Stopping Tasks
Start a Task
Click the Start Task button for the target task in the dashboard list. After confirmation, the system will automatically create a deployment and service in the container cluster to run the dashboard application. The task status changes to "Running" and an accessible dashboard URL is generated.
Stop a Task
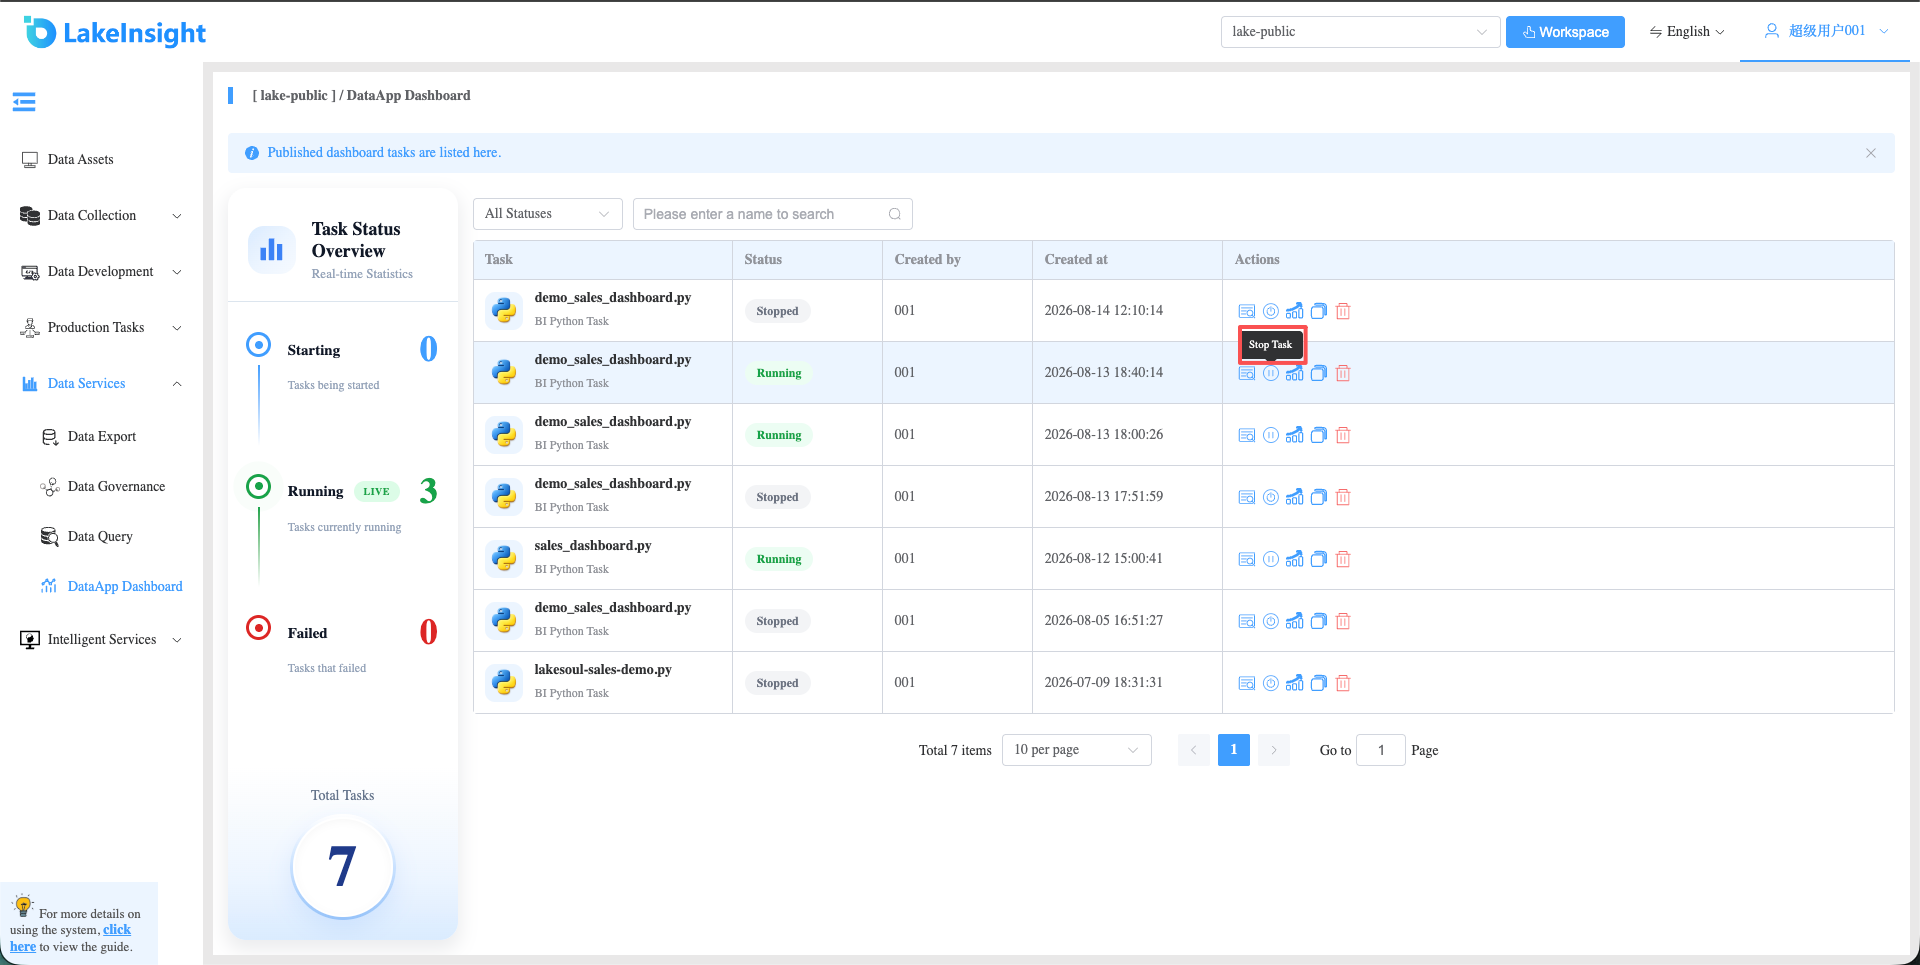
Click the Stop Task button on a running task. The system will reclaim the corresponding container resources, freeing up compute capacity. During the stop process, the status shows "Stopping".
View and Share Dashboard
Once a task is in the "Running" state, you can access and share the dashboard by:
- Clicking the View Dashboard button to open the dashboard in a new browser tab.
- Clicking the Copy Link button to copy the dashboard URL to the clipboard — send it directly to team members, and they can open the link to view.
View Task Details
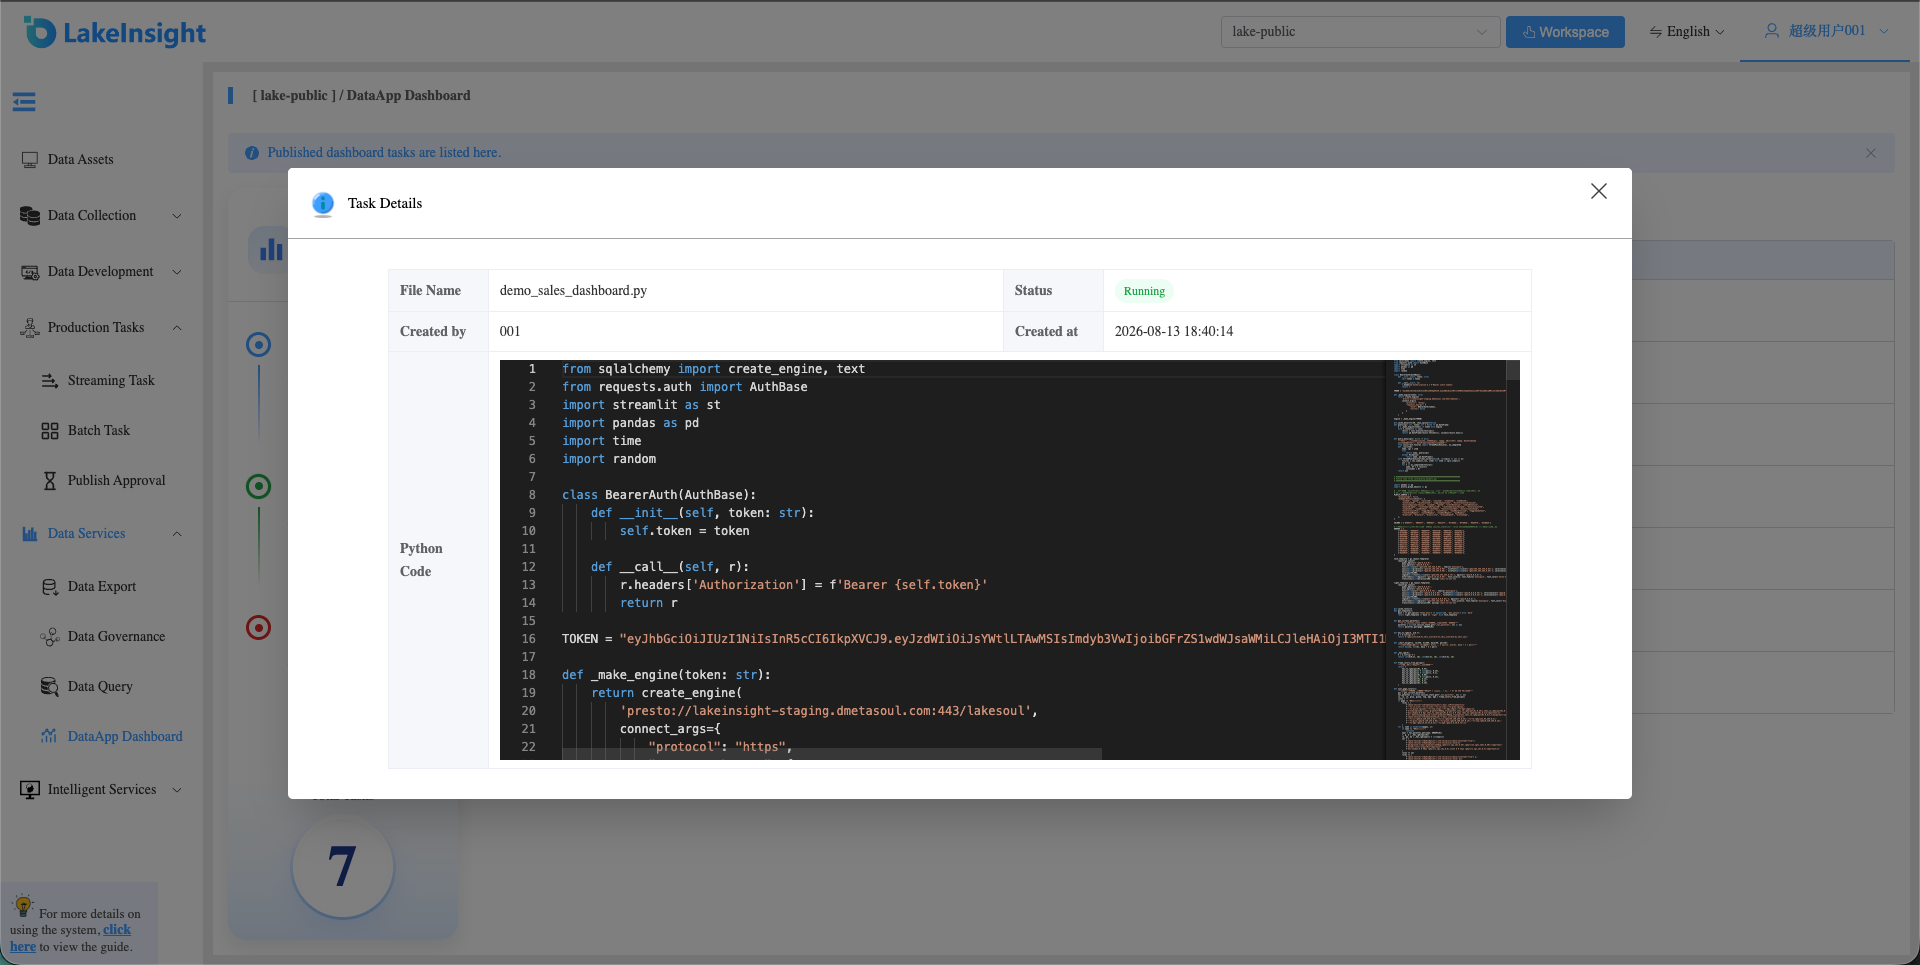
Click the View button on the task row to open the details panel, which shows:
- Basic information such as file name, status, creator, and creation time.
- Python Code: A read-only view of the task's dashboard script content.
Delete a Task
Once the task is confirmed stopped, click the Delete button to remove it. Tasks in the Starting, Running, Paused, or Stopping states cannot be deleted—stop the task first.
Task Status Reference
| Code | Status | Description |
|---|---|---|
| -1 | Not Started | Task created, not yet started |
| 0 | Starting | Deploying K8s resources |
| 1 | Running | Dashboard service is running normally |
| 2 | Succeeded | Task execution completed |
| 3 | Failed | Task startup or execution failed |
| 4 | Stopped | Task has been stopped |
| 5 | Paused | Task is paused |
| 6 | Stopping | Reclaiming K8s resources |
| 7 | Finished | Task completed normally |
| 8 | Waiting Resources | Insufficient cluster resources, waiting in queue |