Usage Statistics
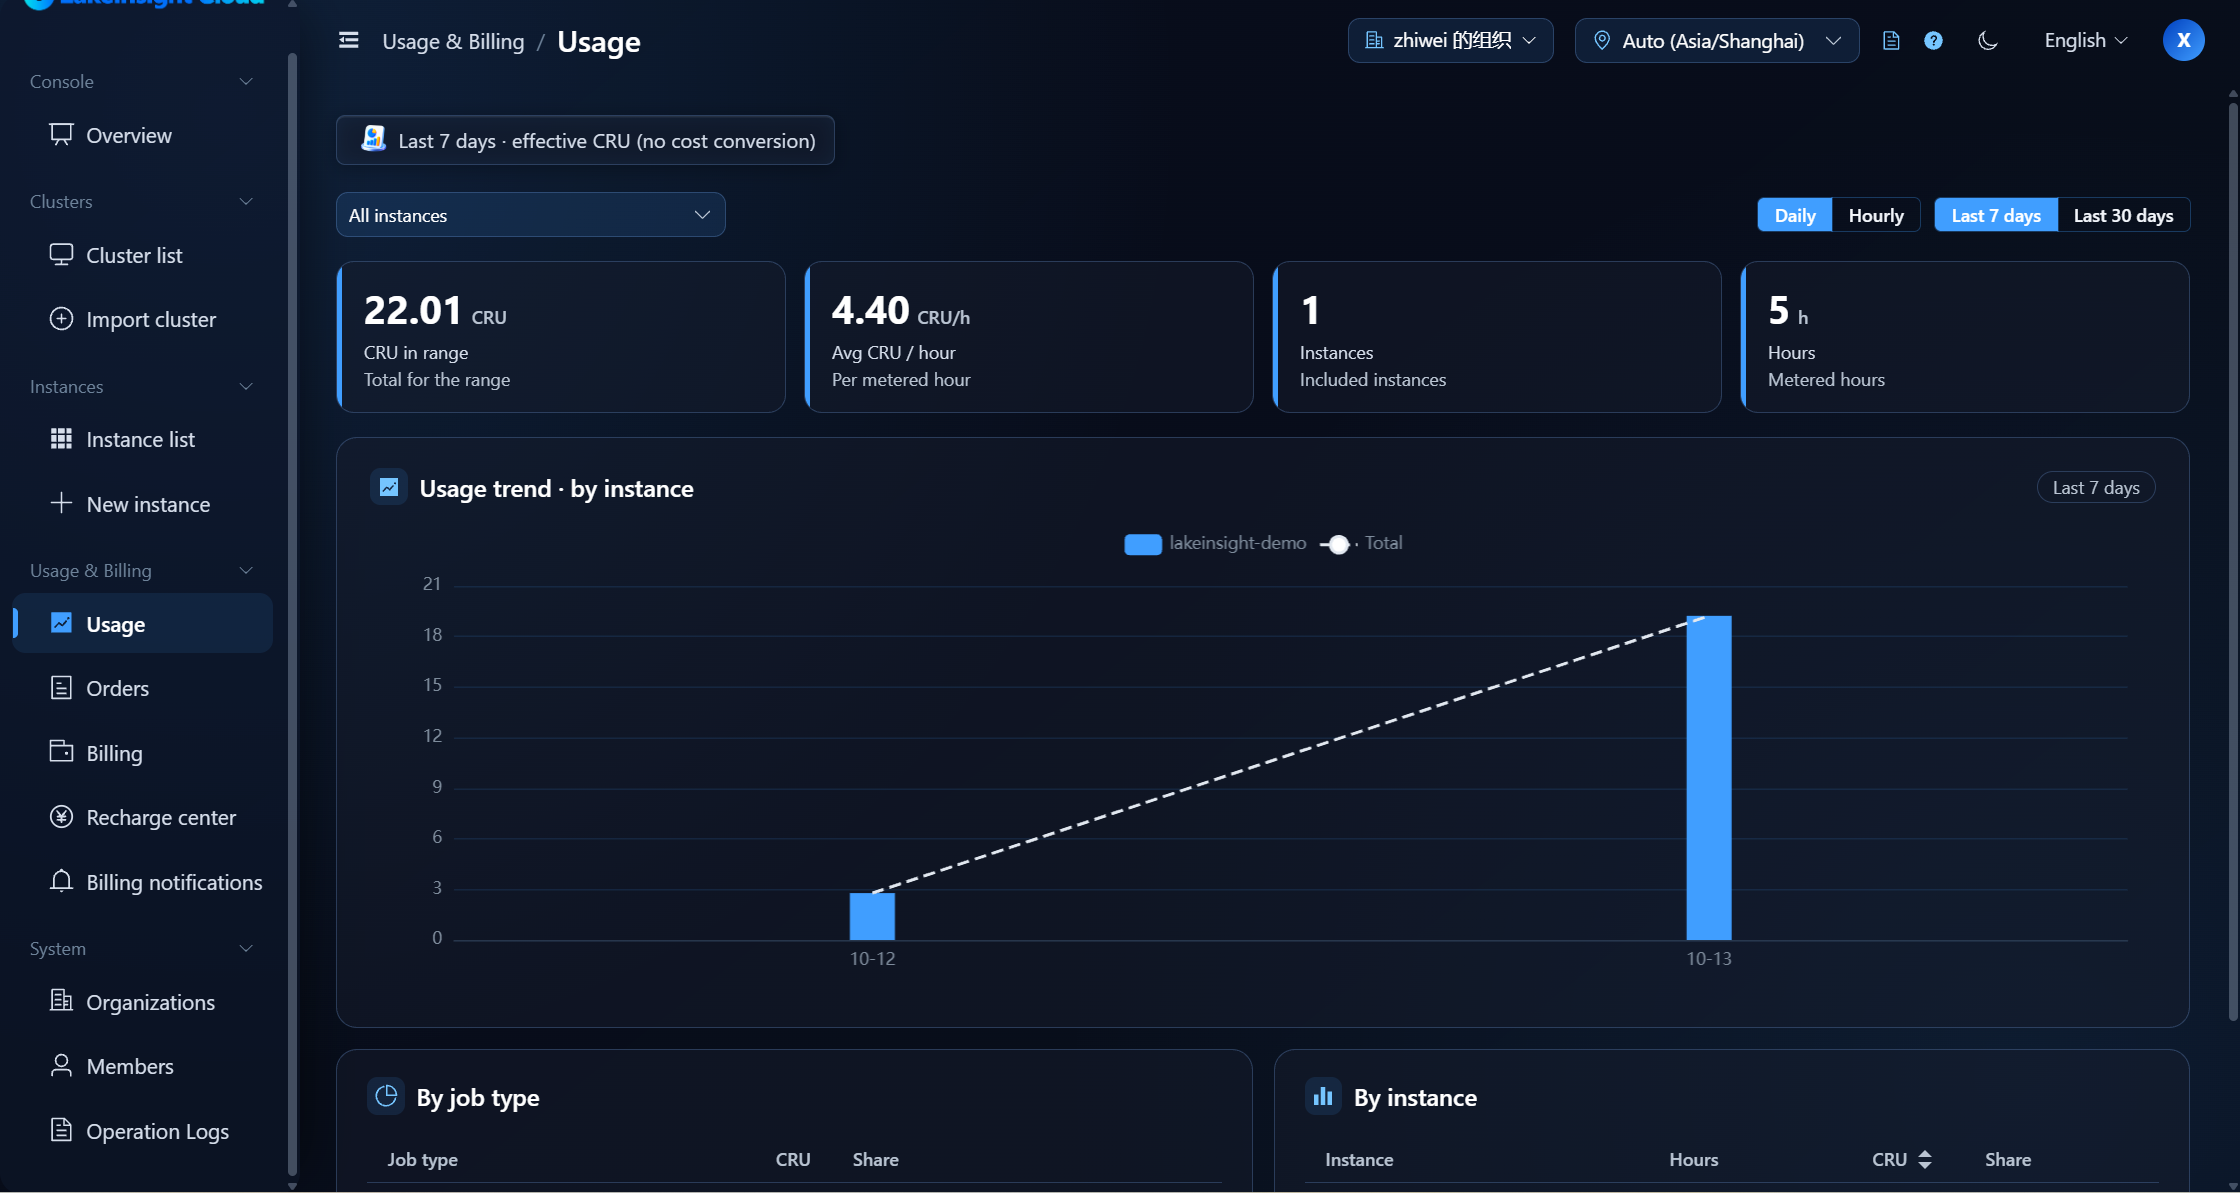
LakeInsight Cloud records the actual resource usage of each running instance and turns it into metered usage. The Usage Statistics page shows how much resource the organization's instances have consumed over a period of time.
Go to Usage & Billing → Usage Statistics to open the page.
What You Can See
Metrics
| Metric | Description |
|---|---|
| Interval CRU | Total CRU consumed by the selected instances over the range |
| Average CRU/h | Interval CRU ÷ metered hours |
| Instances | Number of instances included |
| Hours | Hours with metered usage |
Filters
You can adjust the statistics with the following filters:
- Instance: multi-select; all instances, or one or more specific instances
- Granularity: aggregate by day or by hour
- Time range: the last 7 days or the last 30 days
The chart and tables update together with the filters.
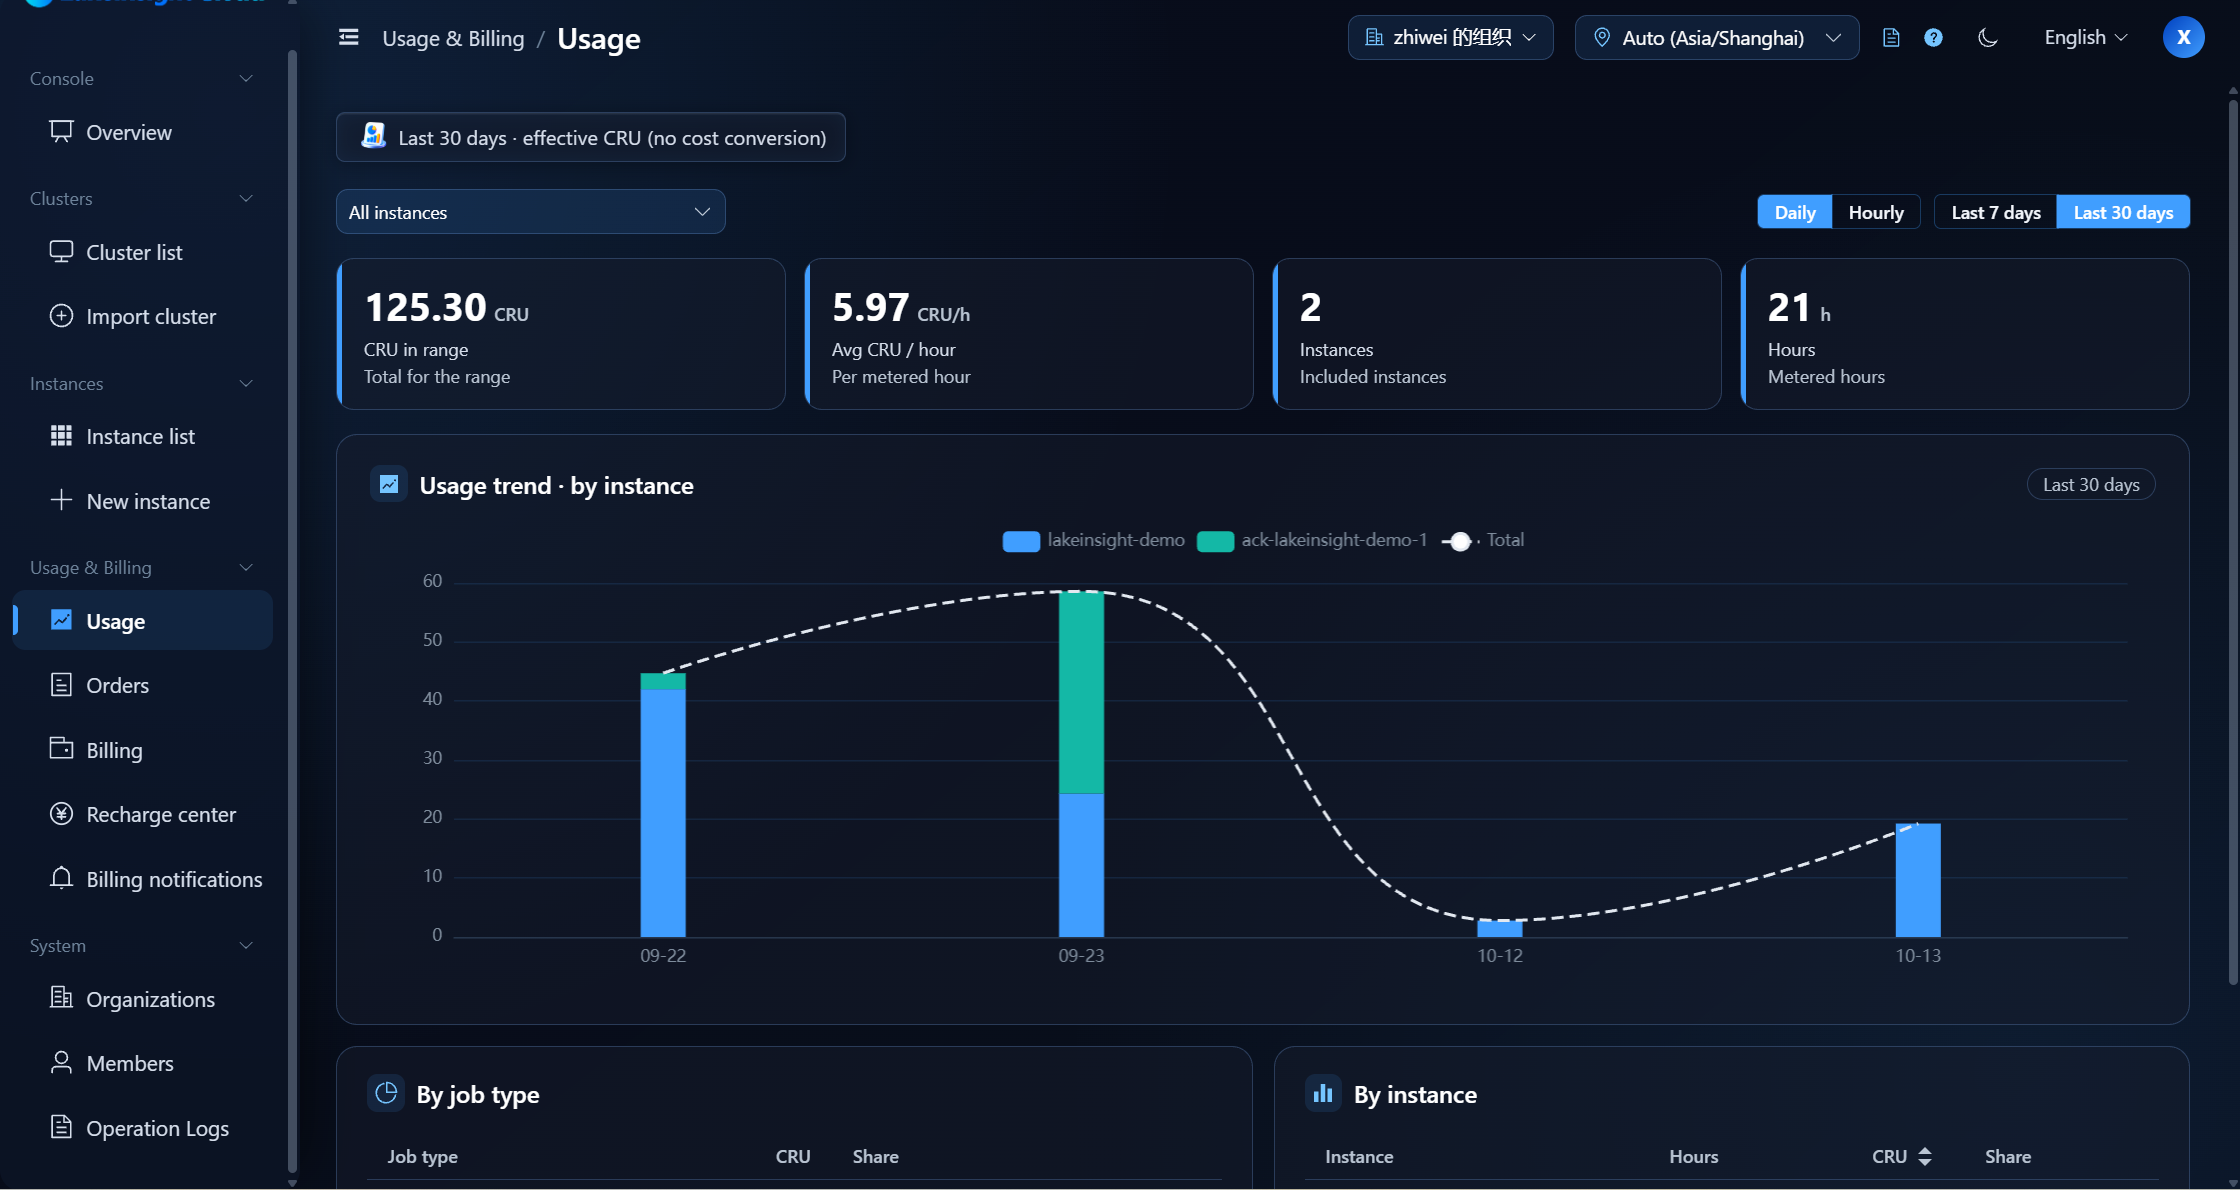
Chart & Tables
- Usage trend: usage over time as a stacked bar split by instance, with a dashed total per time bucket; click a legend item to show or hide an instance.
- Breakdown tables: CRU and share by job type and by instance; click a row in the "by instance" table to filter the whole page to that instance.
Usage vs. Billing
Usage and fees are two related but different views:
- Usage Statistics: raw metered usage, in CRU, to understand how much resource has been consumed.
- Billing Center: the settled fees actually charged, in CNY, to understand the cost.
This page shows effective CRU (raw metered usage) only. Billing settles in UTC hours; the effective CRU is the raw metered value, not scaled by the job type coefficient, so it cannot be multiplied directly by a unit price to obtain a fee. For the actual fees, see the Billing Center (based on settled data).
Next Steps
To learn how to manage instances, see Instance Management.